The Attribution Path Your Model Traces Back to a Creative Asset Tells You About Exposure, Not About What the Creative Actually Did
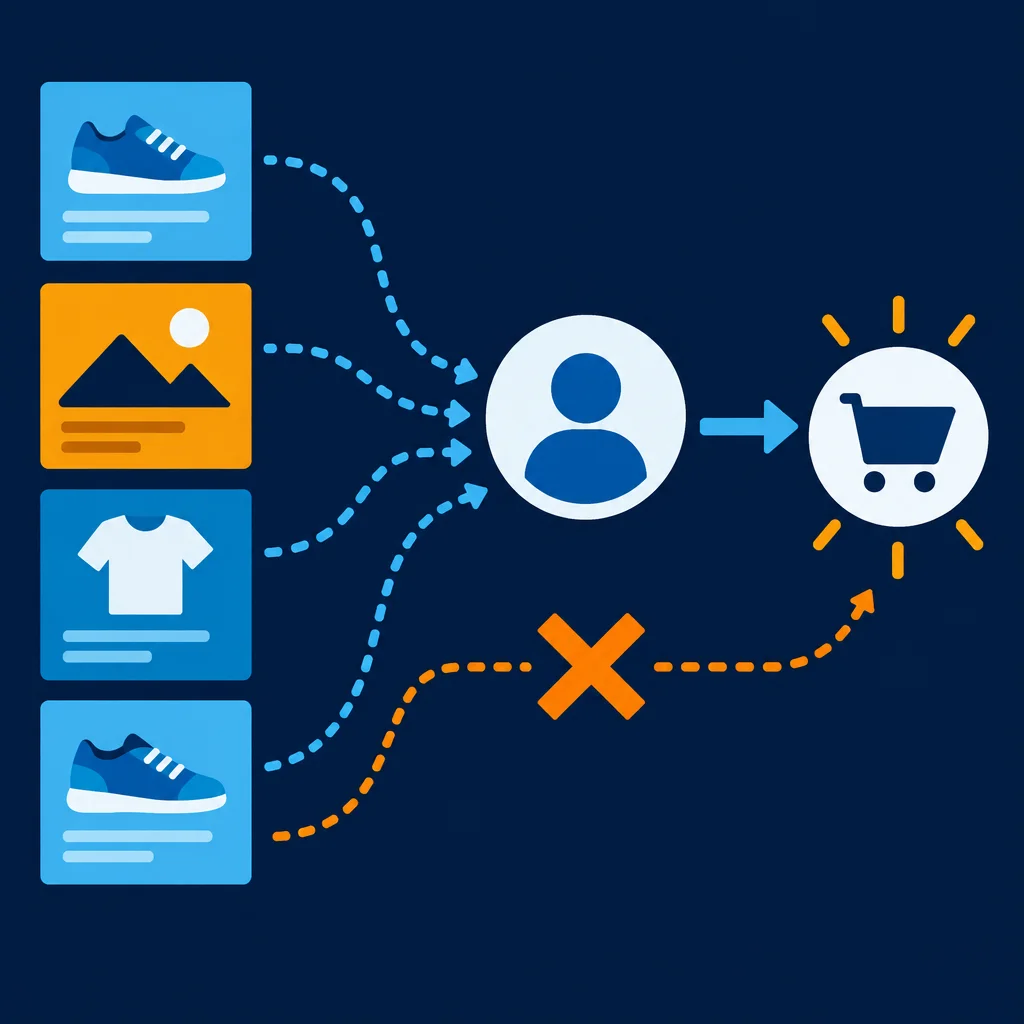
Attribution models record which creative an identifier was exposed to before converting, but that record is not evidence the creative caused the conversion.
When a media buyer reviews post-campaign attribution reports and sees one creative variant outperforming another, the natural read is that the stronger creative drove more conversions. That interpretation is tempting, and it is also incomplete. Attribution models are built to assign credit to touchpoints, not to isolate the effect of any single creative element. Understanding the gap between those two things changes how you use creative performance data in your planning.
What Attribution Models Actually Measure
Most attribution models in active use today, whether last-touch, linear, or time-decay, work by linking an observed conversion back through a sequence of recorded exposures. The model identifies which identifiers were served which impressions before a conversion event was logged, and then it distributes credit across those exposures according to its weighting rules.
Notice what that process measures: exposure sequence and conversion occurrence. The model does not observe whether the person read the ad, whether the message resonated, whether the creative influenced a decision, or whether the conversion would have happened without any exposure at all. A person who was going to convert regardless of what they saw will still appear in your attribution data as a confirmed response to whatever creative they happened to receive last.
This is not a flaw unique to any one vendor. It is a structural property of how attribution works. The model is a bookkeeping system for touchpoints, not a behavioral explanation for outcomes.
Why Creative Looks Like It Has More Influence Than It Does
Imagine, as a hypothetical example, that your campaign runs two creative variants: one featuring a product image and one featuring a lifestyle scene. Your attribution report shows the product image creative with a 40 percent higher conversion rate. A reasonable next step seems obvious: shift budget toward the product image creative.
But before making that call, consider a few things the attribution data cannot tell you. Were the two variants served to the same audience segments, or did your DSP's delivery optimization route them differently based on predicted engagement? Did one variant receive more impressions in lower-funnel placements where conversion-ready users were more concentrated? Were there time-of-day or day-of-week patterns in delivery that correlated with higher baseline purchase intent?
Any of those conditions can produce a performance gap in your attribution report that has nothing to do with the creative itself. The model records what was shown before conversion. It does not control for, or even observe, the conditions under which each variant was delivered.
The Optimization Loop This Creates
The risk is not that one creative gets more budget. The risk is that you build a feedback loop that reinforces delivery patterns rather than creative quality. When a DSP's algorithm learns that one creative correlates with more conversions, it serves that creative to audiences with higher predicted conversion likelihood, which produces more conversions, which reinforces the creative's apparent performance advantage, which prompts more budget allocation toward it.
Over time, the creative that looks strongest in your attribution report may simply be the one that received the most favorable delivery conditions. If you use that signal to guide future creative development, you are optimizing against a proxy that the measurement environment itself helped construct.
This does not mean creative performance data is useless. It means the data needs to be interpreted with delivery context alongside it, not in isolation.
What Would Actually Tell You About Creative Effectiveness
If you want to understand what a creative element is contributing, the tool that gets closer to that answer is a controlled exposure test, not standard attribution reporting. A holdout design where matched audience groups see different creative treatments, with conversion measured at the group level rather than the identifier level, can give you a cleaner read on whether the creative itself is moving outcomes.
That kind of test is more operationally complex than reading an attribution report. It requires coordination with your measurement partner, a decision about holdout size that affects delivery scale, and agreement upfront on what outcome you are measuring and over what window. Those are real costs, and not every campaign justifies them.
For campaigns where creative learning is a stated goal, the investment in a cleaner test design is usually worth it. For campaigns where creative performance is secondary to delivery efficiency, knowing that your attribution data reflects exposure patterns more than creative causation should at least change how confidently you act on what the report shows.
A Practical Reframe for How to Use Attribution Creative Data
Attribution reports are still useful for creative decision-making. They just answer a narrower question than they appear to. What they reliably tell you is which creative identifiers were exposed to in the moments before conversion events clustered. That is a signal about delivery context and audience alignment as much as it is a signal about creative quality.
Some practical suggestions for working with this more carefully:
Check delivery distribution before interpreting creative performance. If two variants did not receive comparable impressions across placements, dayparts, and audience segments, their attributed conversion rates are not comparable either.
Ask your DSP or trafficking team whether creative optimization was running during the flight. If the platform was dynamically routing impressions based on predicted performance, the variants were not in a neutral test environment.
Treat large performance gaps with more skepticism than small ones. A very large apparent difference between variants is more likely to reflect a delivery condition difference than a creative quality difference, especially in short flights with uneven impression volume.
Use attribution creative data as a hypothesis generator, not a verdict. If the product image variant consistently shows stronger attributed performance across multiple campaigns and audience types, that pattern is worth testing more rigorously. The attribution report surfaces the question. A controlled test answers it.
The Underlying Point for Measurement Planning
Attribution models are designed to assign credit across a customer journey. That is a valuable function. But the design assumption built into most attribution systems is that exposure caused the outcome, with the question being only how much credit each touchpoint deserves. The possibility that the exposure was incidental, or that delivery conditions rather than creative content drove the pattern, is outside the model's scope.
For media buyers who use creative performance data to inform future production decisions or to justify budget shifts between formats and messages, knowing that scope boundary matters. The cleaner your test design, the more the data you collect actually answers the question you are asking about creative contribution.